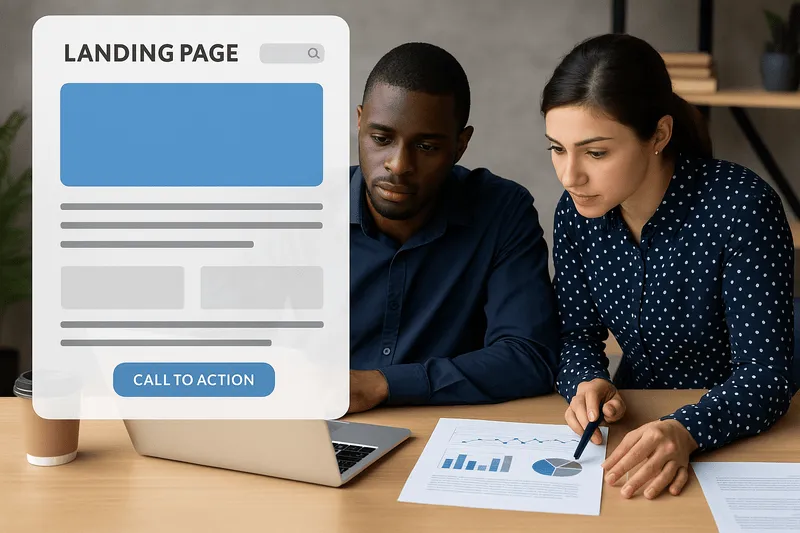
In 2025, the stakes for B2B SaaS landing pages have never been higher. Your prospects are savvier, attention spans are shorter, and competition is fiercer than ever. A landing page is no longer just a digital storefront—it's a high-performance conversion engine, built to turn targeted traffic into trials, demos, and paying customers.
Yet, most SaaS companies still struggle with poorly optimized pages, relying on generic templates that fail to connect with their market's unique maturity stage. The difference between a mediocre landing page and a high-converting one isn't just design—it's a strategic market-aligned framework, backed by data-driven decision-making.
This playbook breaks down the precise elements that make modern B2B SaaS landing pages thrive:
- How to tailor messaging to match market maturity
- The hero section formula that stops the scroll
- Differentiation strategies that drive conversions
- KPI-driven optimization & A/B testing framework
You don't need more traffic. You need better conversion strategies—the kind that turn visits into pipeline growth. Let's dive into the framework that will make your landing page work harder and smarter in 2025.
1. Market Maturity: The Foundation of Every Decision
Before you craft a headline or design a screen, understand your market's maturity:
Mature Market: Prospects know the category. They're comparing solutions.
- Data Point: Companies leveraging targeted messaging in a mature market have seen conversion rates jump from 2% to as high as 12%.
- Strategy: Lead with differentiation.
Evolving Market: Prospects feel the pain, though they're unaware of existing solutions.
- Data Point: Messaging that highlights pain points has demonstrated a significant lift in engagement time and lower bounce rates.
- Strategy: Lead with the problem you solve.
New Category: Prospects aren't even aware they have a problem.
- Data Point: Educational approaches can double the initial visitor-to-MQL rate in new categories by priming the market for change.
- Strategy: Lead with education and awareness.
Every element of your landing page should reflect where your market stands, ensuring that your message resonates and converts.
2. Crafting the Hero Section: Where Data Meets Design
Your hero section is the first impression—and it must perform:
Headline: Tailor your headline to your market:
- Mature Market: "The CRM built for enterprise teams with 500+ reps."
- Evolving Market: "Manual reporting wastes 5 hours per week—here's your solution."
- New Category: "No tools detect revenue leaks in real time—until now."
Subheadline: Build credibility with specifics:
- "Trusted by 500+ finance teams."
- "Cuts churn by 22% in six weeks."
CTA Button: Use clear, action-driven language that can boost the CTA click-through rate (CTR):
- "Start Free Trial" vs. "Get Started"
- "Request Demo" vs. "Learn More"
Visual Proof: Replace generic images with a quick, mobile-optimized (under 200KB) 5-second screen recording to lower load times and increase scroll depth (≥75%).
Data Insight: By monitoring the CTR, scroll depth, and screen recording engagement, you can optimize your hero section continuously for maximum conversion.
3. The Cost of Inaction: What Happens Without Your Solution
Before diving into features and benefits, address the elephant in the room—what's at stake if prospects don't solve their problem. This section creates urgency and justifies the investment in your solution.
Common Pain Points by Market Maturity:
For Mature Markets (Comparison Shopping):
- Revenue Impact: "Companies using outdated CRM systems lose an average of $47,000 annually per sales rep due to inefficient workflows and missed follow-ups."
- Competitive Disadvantage: "While competitors leverage AI-powered insights, manual processes put you 6-12 months behind in market response time."
- Scaling Limitations: "Legacy solutions break down at 100+ users, forcing expensive migrations during critical growth phases."
For Evolving Markets (Pain-Aware):
- Time Waste: "Finance teams spend 15+ hours weekly on manual reporting—that's $78,000 in lost productivity annually for a team of 5."
- Error Risk: "Manual processes have a 23% error rate, leading to compliance issues and potential regulatory fines."
- Missed Opportunities: "Without real-time insights, companies miss 34% of upselling opportunities in existing accounts."
For New Categories (Problem-Unaware):
- Hidden Costs: "Revenue leakage through pricing inconsistencies costs B2B companies 2-5% of annual revenue—often going completely undetected."
- Market Positioning: "Companies without predictive analytics are 40% more likely to lose market share to data-driven competitors."
- Future-Proofing: "Organizations that don't adopt emerging technologies now face 3x higher costs to catch up within 24 months."
Industry-Specific Consequences:
Manufacturing:
- Supply chain disruptions cost manufacturers $184 billion annually
- Poor inventory management leads to 20-30% excess stock
- Manual quality control results in 15% higher defect rates
Financial Services:
- Regulatory compliance failures average $4.7M per incident
- Manual risk assessment delays deal closure by 45%
- Legacy systems increase cybersecurity vulnerability by 60%
Healthcare:
- Administrative inefficiencies waste 30% of healthcare spending
- Paper-based processes increase patient wait times by 25%
- Data silos prevent 89% of care coordination opportunities
4. Your Solution: Tailored by Industry and Role
Now that you've established the stakes, present your solution in a way that speaks directly to different segments of your audience.
Solution Overview by Market Maturity:
For Mature Markets - Differentiation Focus: Present your unique value proposition clearly:
- "Unlike generic CRMs, our platform is built specifically for manufacturing workflows with native ERP integration"
- "The only email marketing tool designed exclusively for SaaS companies with built-in product usage tracking"
For Evolving Markets - Problem-Solution Fit: Connect directly to the pain points you've identified:
- "Automated reporting eliminates those 15 weekly hours of manual work while reducing errors by 95%"
- "Real-time insights help teams spot and capture 34% more upselling opportunities"
For New Categories - Education and Awareness: Guide prospects through the solution concept:
- "Revenue leak detection works by analyzing pricing patterns across your entire customer base in real-time"
- "Predictive analytics turns your historical data into actionable insights for future growth"
Industry-Specific Use Cases:
Manufacturing
- Supply Chain Optimization: "Track materials from supplier to delivery with real-time visibility that prevents $2M+ in disruption costs"
- Quality Control Automation: "AI-powered inspection reduces defect rates by 40% while cutting manual review time by 60%"
- Predictive Maintenance: "Prevent equipment failures before they happen—reduce downtime by 35% and maintenance costs by 25%"
Financial Services
- Risk Assessment: "Automated compliance monitoring reduces audit preparation time by 80% and ensures 99.9% regulatory adherence"
- Deal Processing: "Streamline approval workflows to close deals 45% faster while maintaining risk controls"
- Fraud Detection: "Real-time transaction monitoring catches suspicious activity 90% faster than manual review"
Healthcare
- Patient Flow: "Optimize scheduling and resource allocation to reduce wait times by 40% and increase capacity by 20%"
- Care Coordination: "Connect care teams across departments with unified patient records that improve outcomes by 15%"
- Administrative Efficiency: "Automate insurance verification and billing to reduce administrative costs by 30%"
Role-Based Solutions:
For CFOs and Finance Leaders
- ROI Focus: "Deliver measurable cost savings of $250K+ annually through process automation"
- Risk Management: "Reduce financial risk exposure with real-time monitoring and automated compliance"
- Strategic Insights: "Transform financial data into strategic advantage with predictive analytics"
For Sales Leaders
- Revenue Growth: "Increase deal closure rates by 28% with AI-powered sales insights"
- Team Productivity: "Give reps 40% more selling time by automating administrative tasks"
- Pipeline Visibility: "Never miss another opportunity with complete pipeline transparency"
For Operations Managers
- Efficiency Gains: "Reduce manual processes by 70% while improving accuracy and consistency"
- Resource Optimization: "Maximize team productivity with intelligent task allocation and scheduling"
- Performance Tracking: "Real-time dashboards provide complete operational visibility"
For IT Directors
- Integration Ease: "Connect with existing systems in 48 hours with pre-built integrations"
- Security Compliance: "Enterprise-grade security meets all industry standards and regulations"
- Scalability: "Platform grows with your organization from 50 to 5,000+ users seamlessly"
5. Differentiation & Messaging Alignment: Speak to Your Segment
Different messages work for different market stages. In a data-driven mindset, you can test which message resonates best with your audience:
For Mature Markets: Emphasize your niche:
- "The only CRM designed for manufacturing workflows."
- "Email marketing built exclusively for SaaS companies."
For Evolving Markets: Highlight the pain:
- "Manual reporting drains 5 hours every week—stop wasting time."
For New Categories: Reveal a hidden problem:
- "Most finance teams miss revenue leaks—until now, there's a tool that detects them in real time."
Data Insight: Monitor the average time on page (≥2 minutes) and bounce rate to validate if your messaging is holding visitor attention.
6. Leveraging Social Proof: Trust Built on Data
Social influence is key. But generic logo walls no longer cut it:
Display Recognizable Brands: Showcase 5–7 well-known customer logos with a powerful stat underneath (e.g., "85% see ROI in 60 days" or "Churn reduced by 22% in six weeks").
Use Detailed Testimonials: Include specific names, titles, and measurable outcomes, such as: "Sarah Chen, CFO at TechCorp: We cut churn by 22% in six weeks."
Incorporate Case Studies: Add downloadable PDFs or dedicated landing pages that boost SEO and provide deeper context.
Data Insight: Track returning visitor percentages as a measure of trust and credibility—if testimonials improve trust, expect higher repeat visits.
7. Transparent Pricing: Data-Backed Clarity
Pricing can make or break a conversion:
Standard Pricing: Clearly display your tiers (e.g., "Basic $99/mo, Pro $249/mo") with corresponding usage limits.
Custom Pricing: If your pricing is tailored, use a form-based approach: "Complete this form for pricing"—ensure the form is straightforward and track the form completion rate.
Data Insight: Analyze conversion funnel drop-off at the pricing stage. A well-structured pricing section correlates with a significant increase in the trial-to-customer conversion rate.
8. A/B Testing & Continuous Optimization: The Data Backbone
Every element should be seen as a hypothesis to test:
Test Headlines: Compare variations (differentiation vs. pain-focused) and measure impact on visitor-to-MQL conversion rate.
Optimize CTAs: Experiment with different calls-to-action ("Start Free Trial" vs. "Try It Now") to determine which yields better CTR and lower time to first interaction.
Hero Visual Testing: Use A/B tests for static images versus dynamic visuals (short GIFs or screen recordings) to identify which drives better engagement.
Social Proof Formats: Evaluate static logos against detailed testimonials or data-driven stats to see which increases trust metrics.
Iteration Cycle:
- Test one element at a time.
- Gather data for at least two weeks using tools like Hotjar or FullStory.
- Analyze results based on key KPIs.
- Implement changes and reiterate.
Data Insight: Every adjustment reflects in your KPI dashboard and helps drive incremental, yet significant improvements in conversions.
9. The Unified KPI Dashboard: Measure What Matters
For a truly data-driven approach, consolidate your metrics into one dashboard:
| Metric Category | Key Metrics | Why It Matters |
|---|---|---|
| Conversion & Engagement | Visitor-to-MQL conversion rate, CTA click-through rate, Scroll depth (≥ 75%), Average time on page (≥ 2 minutes), Bounce rate | These metrics indicate how effectively your page engages and converts. |
| Lead Quality & Pipeline | Form Completion Rate, Sales Qualified Lead (SQL) conversion rate, Trial-to-Paid conversion rate | These demonstrate the quality of leads and progression through your funnel. |
| Behavioral & Funnel Analytics | CTA hover vs. click rate, Returning Visitor percentage, Navigation flow analysis | These insights reveal user interaction patterns and potential drop-off points. |
Data Insight: By focusing on this consolidated KPI dashboard, every optimization—from the first impression to the final pricing step—is measurable and actionable.
10. Pre-Launch Checklist: Ensure Data-Ready Perfection
Before going live, verify that every component is optimized and measurable:
- Headline: Clear and concise (8–12 words).
- Hero Visual: Loads in under 2.5 seconds.
- Design: Responsive and accessible (mobile-first, proper alt texts, ARIA labels).
- Proof Links & Case Studies: All external and internal links work seamlessly.
- Tracking Setup: Ensure all analytics tools are correctly configured to capture the KPIs listed.
Frequently Asked Questions
Q: How long should my B2B SaaS landing page be?
A: Length depends on your market maturity and deal complexity. For simple, low-cost solutions in mature markets, shorter pages (3-5 sections) often work best. For complex, high-value solutions or new categories, longer pages (8-12 sections) that educate and build trust typically convert better. Test both approaches with your audience.
Q: Should I always include pricing on my landing page?
A: Include pricing when your solution has standard tiers under $500/month. For enterprise solutions or complex pricing models, use a "Get Pricing" form instead. The key is reducing friction—if prospects expect to see pricing and don't find it, you'll lose conversions.
Q: How often should I A/B test my landing page elements?
A: Test one element every 2-4 weeks, allowing enough time to gather statistically significant data. Focus on high-impact elements first: headlines, CTAs, and hero visuals. Avoid testing during seasonal periods or major marketing campaigns that could skew results.
Q: What's the biggest mistake B2B SaaS companies make with landing pages?
A: Generic messaging that doesn't align with market maturity. Companies often use the same "increase productivity and save time" message regardless of whether they're in a mature, evolving, or new category. This leads to weak differentiation and poor conversion rates.
Q: How do I know if my landing page is performing well?
A: Benchmark against industry standards: 2-5% visitor-to-lead conversion for B2B SaaS, 20-30% trial-to-paid conversion, and average time on page of 2+ minutes. However, focus more on month-over-month improvement than absolute numbers, as your specific market and price point heavily influence these metrics.
Q: Should I create separate landing pages for different industries or job roles?
A: Yes, when you have sufficient traffic (1,000+ monthly visitors per segment) and distinct value propositions. Create targeted pages for your top 2-3 segments first, then expand based on performance data. Personalized landing pages typically see 2-5x higher conversion rates than generic ones.
TL;DR
Your B2B SaaS landing page success depends on three critical factors: market maturity alignment, consequence-driven messaging, and data-driven optimization. Match your messaging to whether prospects are comparing solutions (mature market), feeling pain but unaware of solutions (evolving market), or don't know they have a problem (new category).
Highlight the specific costs of inaction—lost revenue, wasted time, competitive disadvantage—before presenting your solution with industry and role-specific use cases. Continuously test and optimize using KPIs like visitor-to-MQL conversion rate, scroll depth, and time on page.
The companies winning in 2025 don't just create landing pages—they build conversion engines that turn market understanding into measurable pipeline growth.
Get the monthly briefing
One high-signal edition a month on B2B growth, AI search, and agentic marketing. No noise, unsubscribe anytime.